An up-to-date database of households and climate
Our results are based on the analysis of a new database that combines the up-to-date household-level survey data covering 2172 subnational regions in Brazil, Mexico, India, and Indonesia over the 2003–2018 period, with gridded cooling degree days (CDDs). We respond to recent demands to account for the influence of relative humidity7,8 by using wet-bulb temperature as a more accurate measurement of thermal discomfort that, contrary to dry-bulb temperature, does not overestimate temperature at low humidity levels29. To better reflect tropical conditions, we use a higher baseline temperature of 24 °C as opposed to the 18 °C value used in most studies on air temperature impacts and building energy demand30. Because temperature set-points can vary across households4, we also consider a lower temperature threshold of 22 °C as a robustness test. The combination of two temperature thresholds with calculations based on dry-bulb and wet-bulb temperatures makes it possible to evaluate the sensitivity of the results for different countries to the climate metric used. For the sake of clarity, in the remainder of this paper, CDDs refer to those computed with wet-bulb temperature and at a base temperature of 24 °C (see section “Climate Data” in Supplementary Information, where results based on CDDs computed with dry-bulb temperature are also shown). Brazil, Mexico, India, and Indonesia are all tropical countries characterized by relatively high average wet-bulb CDDs, though there is significant variation from one country to another (Supplementary Fig. 1). Climate variation remains significant even within each of the four countries considered. The highest long-term average values of wet-bulb temperature are observed in Indonesia and India, although climate heterogeneity between and within countries highlights the presence of high-CDD regions even in Brazil (Fig. 1a). The diffusion of air-conditioning units across districts and states closely mirrors patterns of hot climate conditions in the climate maps, though urbanization and access to electricity play a mediating role (see Supplementary Fig. 1). In India, for example, the highest CDD values, observed in the states of West Bengal, Assam, Uttar Pradesh, and Orissa, are not associated with the most widespread use of air-conditioning. Households in those regions are mostly rural and often lack access to electricity, as implied by low ownership rates of refrigerators. Fans, which consume less energy and do not require a stable connection, are more widespread throughout the country. In Brazil, the state of Rio de Janeiro shows relatively high adoption rates for air conditioners, despite the lower number of annual CDDs compared to its northern states, where urbanization is low. Although Indonesia has the highest values of CDDs, households rarely own air-conditioning units, except for the districts of Jakarta and the Riau Islands.
Fig. 1: Climate, air-conditioning, and income characteristics in four selected emerging economies.
a A 30-year average of gridded wet-bulb cooling degree days (CDDs), up to the second wave of household data used in the study (2009 for Brazil and 2012 for all other countries). b Rates of air-conditioning (AC) ownership in relation to per capita total expenditure (2011 US constant dollars at PPP) and comparison to other cooling devices in the second wave of household data. The black dashed line shows the distribution of households (HH) across income levels. Maps are generated using the sp, rgdal, and raster R packages.
Climate is only part of the story, as shown by India and Indonesia. For the same level of total expenditure per capita, air-conditioning ownership rates are the highest in India and the lowest in Indonesia (Fig. 1b). In these Asian regions, average annual total expenditure per capita, which we use as an indicator of lifetime income, is below 10,000 USD for nearly all households. The expenditure distribution has a larger variance in Brazil and Mexico where, on average, of at least a quarter of households reports annual total expenditure per capita above 10,000 USD. Across all countries air-conditioning ownership is quite low (12% in India in 2012, 14% in Mexico in 2016), even in Indonesia and Brazil where more recent data are available (8% in Indonesia in 2017, 20% in Brazil 2018). By comparison, fans and refrigerators are more widely used. In India, as early as 2012, fans were owned by 73% of households, even among those with very low-income levels. Refrigerators have the highest adoption rates in Brazil and Mexico (See Supplementary Table 4 for descriptive statistics). Electricity expenditure reflects the ownership patterns of energy-consuming durables. Absolute values are the highest in Brazil and Mexico though, in relative terms, Indian households spend the largest share of their budget on electricity, between 3.4 and 4.5%.
Drivers of air-conditioning adoption
We estimate adoption models for air conditioners for each individual country by using the two most recent survey waves available with a logit model (see “Methods”). To understand how adoption patterns differ from more commonly owned goods, we also look at the adoption of refrigerators and fans. While fans can substitute air conditioners in the space cooling service they provide, air conditioners are more comparable to refrigerators in terms of the budget required to purchase them. By using two waves, we can control for country-specific, time-varying unobservable trends that affect all households, such as changes in the prices of appliances and country-level regulations.
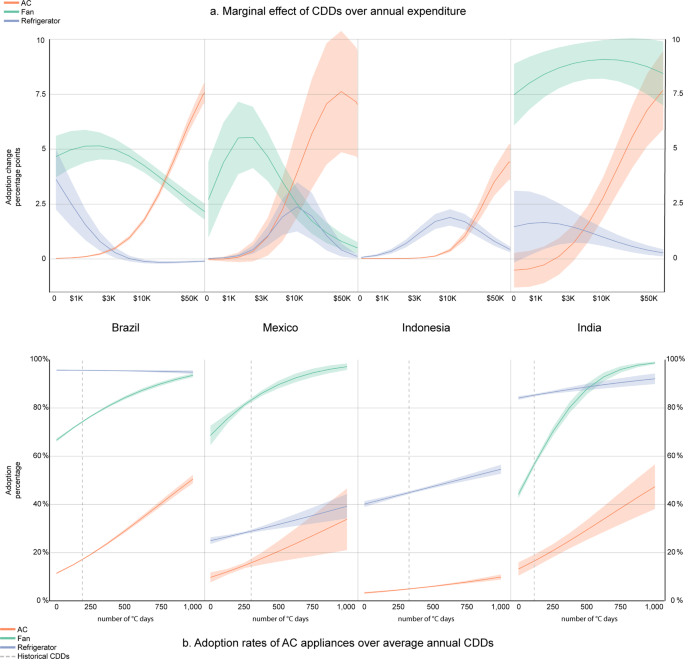
Income conditions and climate are both important drivers of the decision to adopt air conditioners across all countries (Table 1), but their relative contribution varies in relation to other household characteristics (Supplementary Table 7). The marginal effect of total expenditure is always larger than that of CDDs (except for fans in Mexico), but climate remains an important factor, especially in Brazil and Mexico. Fans, which in the short-term have the lowest costs, are generally more sensitive to CDDs as compared to air-conditioning. Especially in the warmer countries, India and Indonesia, education and the quality of dwellings correlate with a household’s wealth and are more strongly related to the adoption of refrigerators and air-conditioning, the most expensive goods. The extent to which climate affects the decision to adopt also depends on a household’s average income level. The interaction term between CDDs and total expenditure (Supplementary Table 5) indicates that households respond to rising temperature levels by purchasing a new air-conditioning unit only when their average annual income is sufficiently high (Fig. 2a). Moreover, as income increases, households tend to substitute fans with air-conditioning. Refrigerators provide a different service that is desirable across all climates but, as income increases, refrigerators become less sensitive to climate. The adoption of refrigerators responds to CDDs at low-income levels in Brazil and Mexico—where adoption is higher—and at medium income levels in India and Indonesia—where adoption is still quite low.
Table 1 Total marginal effects for CDDs wet-bulbs and total expenditure from standardized logit models based on the two most recent waves for air-conditioning (AC), fans (FAN), and refrigerators (REF).Fig. 2: Drivers of air-conditioning adoption.
a Marginal elasticity of air-conditioning adoption to a one-hundred increase in CDDs across income levels. b Predicted adoption rates of AC and other cooling devices for varying CDDs wet-bulbs. All other drivers are assumed at their historical mean value (full regression results shown in Supplementary Table 5). The vertical dashed line marks the country-specific, long-term historical average of CDDs. Shaded areas represent the dispersion in predicted adoption levels across households.
Demographic and infrastructural characteristics are also important factors in explaining adoption patterns, and their relative contribution, compared to income and climate, varies across countries and the type of good considered (Supplementary Table 6). Urbanization increases the probability of adopting cooling durables, and so does home ownership, though this factor is of less importance in comparison to living in major urban centers. Since for Brazil we lack information on districts, regressions only consider households located in the strata of capital and urban regions because for these strata, the geographical climate information are more accurate. The regressions for Brazil, therefore, do not include the urbanization variable. Education substantially enhances the propensity to adopt all types of goods considered in all countries. The housing index, which combines information on the quality of roofs, toilet and walls, shows a positive relationship with adoption propensity, indicating that households occupying higher-quality homes are more likely to install an air-conditioning unit. Demographic factors show a robust influence across goods and countries. Household size has a negative sign, whereas the presence of members under 16 years of age has a positive influence. Households with older family heads are more inclined to have a cooling appliance, probably because such persons spend more time at home. Employed household heads, who spend less time at home, are less interested in owning air conditioners. Findings on gender are mixed, and whether having a male head increases or not the propensity to adopt and use of cooling devices varies across countries. Not including this rich set of households’ characteristics would significantly bias income and CDD elasticities, which would be estimated to be larger (Supplementary Table 11). Over time, the ability of households to adapt to climate conditions increases. When adoption behaviors are estimated by using only the most recent wave, income and CDD elasticities are significantly larger (Supplementary Table 11), indicating that, for the same income level, climate conditions, as well as all other covariates (ceteris paribus), households have a higher probability to adopt air-conditioning in the most recent waves. The higher adaptive capacity of households could also reflect the rapid decline in air-conditioning prices observed over the last twenty years31, though we cannot formally test this hypothesis with our current data.
While new technologies widen the space of adaptation options available to households, contributing to enhancing their adaptive capacity, actual adaptation depends on behaviors and specifically on how electricity is used. Although we do not observe the specific consumption of electricity for space cooling, we know the total electricity consumption of households. Not only can air-conditioning be reasonably assumed to be more sensitive to changes in temperature than other final usages, but it is also much more energy-intensive compared to fans32. Most of the factors that positively influence the adoption of air-conditioning adoption—CDDs, income, urbanization, education, home ownership and housing index—are also positively related to electricity consumption (Supplementary Table 9).
As CDDs increase above historical levels, air-conditioning generally rises more rapidly than fans and refrigerators, especially in Brazil (Fig. 2b). In India and Indonesia, the speed of diffusion aligns with that of other devices. In Mexico, fans reach a saturation point very rapidly, reflecting the relatively higher correlation with CDDs in a country characterized by very heterogeneous climate conditions.
Even within tropical regions, temperature measurements based on dry-bulb temperature can over-estimate CDD elasticities, depending on how air-conditioning is distributed across sub-regions with different micro-climates and humidity levels (Supplementary Table 12). If climatic conditions are measured with dry-bulb CDDs, the estimated CDD elasticities are significantly larger in Mexico and India and only slightly so in Brazil. Mexico and India have a high concentration of air-conditioning in the regions characterized by a particularly arid climate (warm arid and very hot dry climate conditions). Overall, our results are robust in relation to the use of different temperature thresholds, as well as to different measurements.
Future adoption of air-conditioning around mid-century
We simulate how changes in future climate and socio-economic conditions will influence a household’s air-conditioning adoption and electricity use around 2040 (see “Methods”) by combining the change in CDDs simulated under two scenarios of moderate and vigorous warming, as described by the mean climate model representative concentration pathways (RCPs) 4.533 and 8.534 with changes in income described by five different shared socio-economic pathways35,36. In India CDDs increase by a factor of 1.9–2.3, while total expenditure increases by a factor of 4–7 across SSPs. In Indonesia (Brazil), CDDs increase by a factor of 5–9 (6–8) across RCPs while total expenditure by a factor of 3–4 (1.6–2.5) across SSPs. In Mexico CDDs and total expenditure increase by a factor of 1.7–2.5 across SSPs and RCPs.
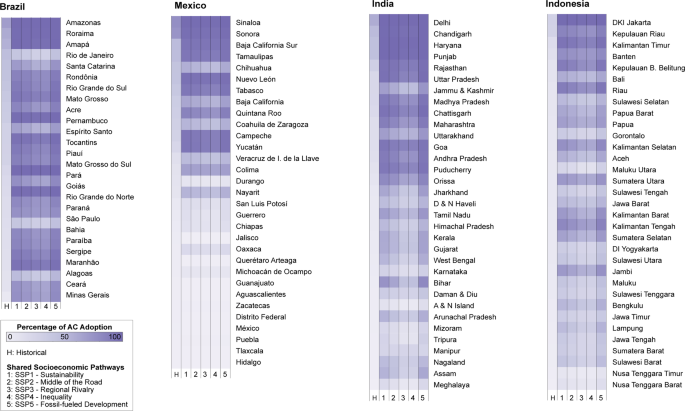
Increase in the adoption of air-conditioning is substantial (Fig. 3 and Supplementary Tables 18–21). In India, the average adoption rate across Indian states increases from 12% in 2012 to 49–69%, across SSPs and RCPs, in 2040; in Indonesia, from 8% in 2017 to 43–61%, in Mexico from 14% in 2016 to 35–42%, and in Brazil from 20% in 2018 to 65–85%. In Brazil, the largest increases are observed in its more affluent states in the southern and southeastern parts of the country, such as São Paulo, where air-conditioning rises from 16 to 78% in SSP5, RCP8.5, and Mato Grosso do Sul, which, starting from 28%, achieves full saturation (90% in SSP5, RCP8.5; results across SSPs and RCPs are available in the Supplementary Material). Brazil’s northern states have higher historical ownership rates and therefore see a relatively smaller increase, though they achieve the largest shares by 2040. To mention a few examples, Amazonas, with the contribution of the city of Manaus, Pará, and Tocantins range from 69%, 23%, and 29% in 2018, respectively, to full ownership. In Mexico, the average ownership rates in its hotter states are comparatively high already in the historical records, reaching 73% in Sonora or 77% in Sinaloa. The country’s average increase in air-conditioning ownership is mediated by the inland regions, which are characterized by very low CDDs and hence no use of air-conditioning. In India, heterogeneous conditions in the access to electricity contribute to determining a more diverse situation across states. We do not model expansion in electricity access and therefore our projections represent households that already have access to electricity at present. This is not an issue for Mexico and Brazil, as they practically coincide with the total survey population (more than 97%). It might lead to an underestimation of AC expansion in Indonesia and India where many households still lack access. The largest increases in air-conditioning are seen in the northeastern part of the country, close to the border with Bangladesh, in states such as Assam, Bihar, Nagaland, and Meghalaya, where CDDs reach the highest values in the country. In India, 6 out of its 35 states, Delhi, Chandigarh, Haryana, Punjab, Rajasthan, and Uttar Pradesh, are expected to achieve full ownership, though only Delhi, Haryana, and Punjab do so across all scenarios. Indonesia exhibits the smallest variation in air-conditioning ownership rates across states. Compared to the other three countries, nearly all states show high CDDs. Still, air-conditioning ownership rates remain relatively low when economic growth is considered. Only Jakarta will come close to full ownership across all scenarios considered in 2040, starting from its 2017 average adoption rates of 30%. Increasing electricity demand also appears to be a ubiquitous form of adaptation (Supplementary Fig. 7), and the interquartile range of the estimated growth factor is always positive (Supplementary Tables 14–17).
Fig. 3: Future average air-conditioning adoption rates across country states in 2040 under RCP8.5-warming.
States are ranked from top to bottom, based on historical ownership rates. State-level adoption rates are computed as weighted average of household-level projected adoption rates (see “Methods”).
How temperature is measured and how the comfort setpoint is defined are two important sources of uncertainty that could generate different projections, arising from the interaction between the estimated elasticities and the changes in the temperature variables and the associated degree days. When the estimated elasticities are combined with future CDDs, future projected air-conditioning can be lower when using wet-bulb CDDs (Mexico) because of the lower estimated elasticities, but they can also be higher (Brazil) because only slightly smaller elasticities interact with a larger increase in wet-bulb CDDs relative to the historical period compared to dry-bulb CDDs. Since historical wet-bulb CDDs are much lower than dry-bulb CDDs, their growth rate is higher. Projections based on the 22 °C temperature threshold tend to underestimate projections based on the 24 °C temperature, especially when using wet-bulb measurements (Supplementary Table 12 and Fig. 8).
Adaptation cooling deficit
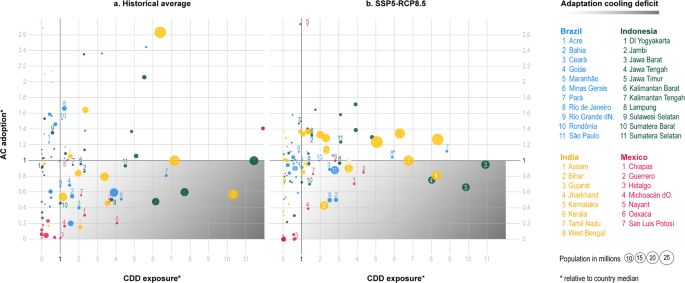
Changes in climate and income conditions will allow more households to have an air conditioning unit by 2040, even when considering the uncertainty characterizing future socio-economic conditions. Yet, a non-negligible fraction of the population will be left behind. Our findings show that in 2040, between 64 and 100 million households (in SSP5-RCP8.5 and SSP3-RCP45, respectively) out of the total number of households living in the four countries considered in the latest waves of 343 million will face an adaptation cooling deficit. These households will face climate conditions warmer than their own country average, measured in terms of a country-specific CDD exposure ratio, and yet they will not be able to protect themselves with air-conditioning, as indicated by an air-conditioning availability ratio. We measure total CDD exposure as in Biardeau et al.7 by multiplying country- and state-level CDDs by the total number of households. We then compute the CDD exposure ratio for each subnational state across the four countries. When state-level CDD exposure is higher than the country median, the ratio takes a value larger than one and proportional to the distance from the median. This exposure ratio is compared to the AC ratio, which is defined in a similar way. When the state-level average AC ownership rate is smaller than the country median, the ratio takes a value smaller than one, proportional to the distance from the median. When the state-level average air-conditioning ownership rate is larger than the country respective median, the ratio takes a value greater than one and proportional to the distance from the median.
By combining these two ratios, Fig. 4 divides the four countries’ states into four groups, for the historical (left panel) and future period (right panel). The imaginary diagonal running from the top-left to the bottom-right quadrant sheds light on the cooling inequality characterizing these countries. States in the top-left quadrant have high adoption rates relative to the country median, despite having lower-than-average CDDs. The state of Rio de Janeiro in Brazil is an example. States in the bottom-right quadrant raise concerns because they have lower-than-average adoption rates despite the higher-than-average exposure to hot climate conditions.
Fig. 4: Adaptation cooling deficit.
Current situation (a, latest wave available) and future projections in 2040 with RCP8.5 warming and SSP5 (b) computed with Cooling Degree Days (CDDs). Bubble size proportional to the current number of households relative to each country’s maximum. For the historical period, the following waves are used: Brazil, 2018 India, 2012, Indonesia, 2017, Mexico, 2016. Colors are used to differentiate the four countries. See http://www.energy-a.eu/cooling-deficit/ for the interactive online version.
Since socio-economic conditions improve at a faster rate than the increase in CDDs, in comparison with the historical data, the number of states with households experiencing a cooling deficit declines. Brazil and India potentially experience the largest reduction in the adaptation cooling deficit, going from 23 million in 2018 to 8–13 million across the 2040 socio-economic and warming scenarios in Brazil, and from 54 million in 2012 to 29–58 million households in India. In Indonesia, the change is from 26 million households in 2017 to 20–28 million. In Mexico, the historical situation would not change significantly, and it could even worsen (from 5 million in 2016 to 4–6 million households). States with high urbanization levels, hot and humid climate, or with generally poor economic conditions are more likely to face a cooling deficit. Consider, for example, the state of Jharkhand in northeastern India. Because air-conditioning does not keep pace with population and CDDs growth, its position shifts from the top to the bottom-right panel.
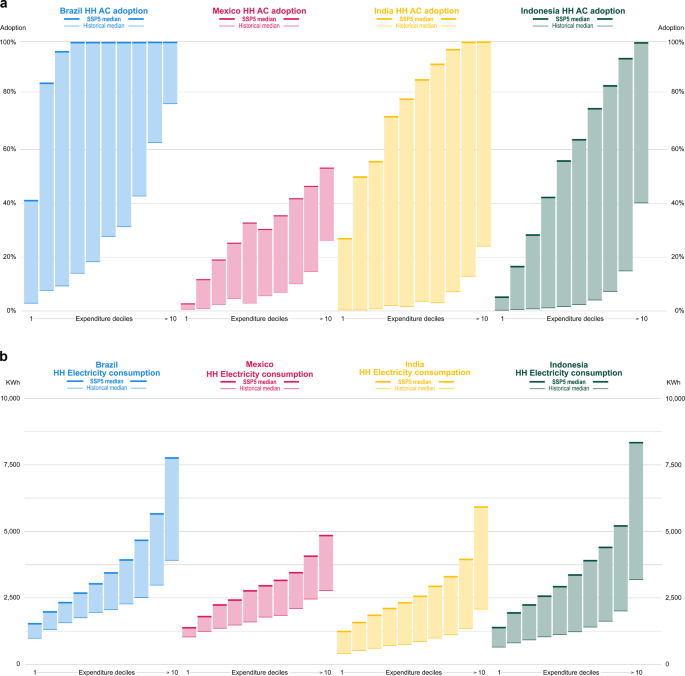
The greatest increase in the adoption of air conditioners will be among middle-class and wealthy families, though actual electricity use will rise especially among the wealthiest households (Fig. 5). Electricity use increases with income (Supplementary Tables 9 and 10), though families sharing similar socio-economic conditions might still have very different usage patterns due to building characteristics, appliance efficiency, climate, and infrastructure conditions, which we can only imperfectly account for. The adaptation cooling deficit persists, especially within the lowest income groups. In 2040, median adoption rates in the first total expenditure decile vary between about 1% (SSP3, RCP4.5) and 27% (SSP5, RCP8.5) in India, between less than 0.1 and 40% in Brazil, between 0 and 3% in Mexico, and between less than 0.1 and 5% in Indonesia. The wealthiest households drive the aggregate implications in terms of energy use, which are substantial. Electricity increases by about two to three times in Indonesia and India, while the increase is less dramatic in the Latin American countries (Supplementary Tables 14–17). Results show a higher sensitivity to socio-economic scenarios. The distribution of projected air-conditioning and electricity growth rates are not statistically different across climate scenarios, whereas they are across SSPs.
Fig. 5: Future increase in air-conditioning and electricity use.
Air-conditioning adoption rates (a) and total final electricity use (b) by income decile in the SSP5 RCP8.5 scenario (historical values refer to the latest available wave, Brazil, 2018; India, 2012; Indonesia, 2017; Mexico, 2016). Horizontal lines show the historical (thin line) and future (thick line) median share across states, as influenced by changes in total expenditure and CDDs. Colors are used to differentiate the four countries and shaded areas highlight the increase between today and 2040.
